Setting Up KPI Dashboards for Your Webinar

The Ultimate Guide to Setting Up KPI Dashboards for Your Webinar Success
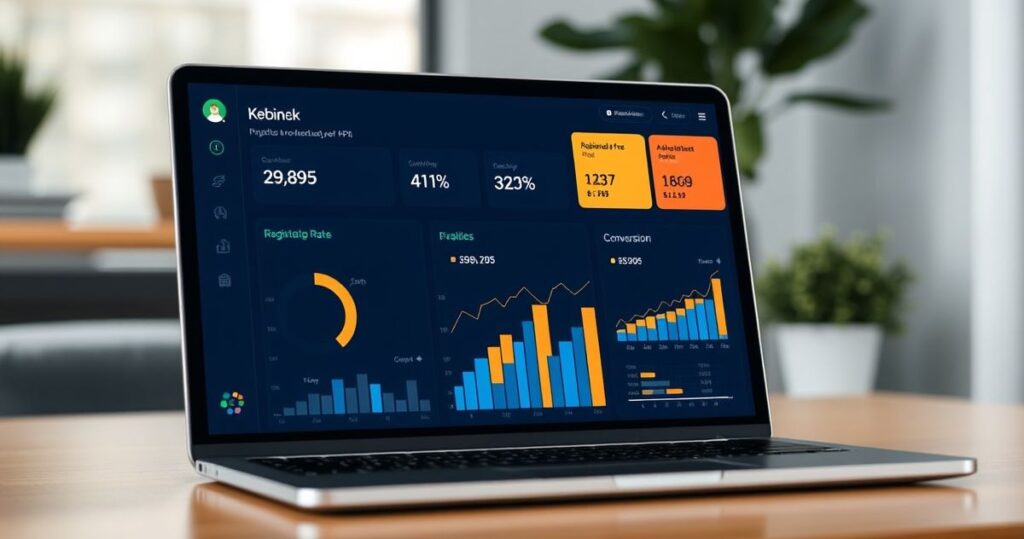
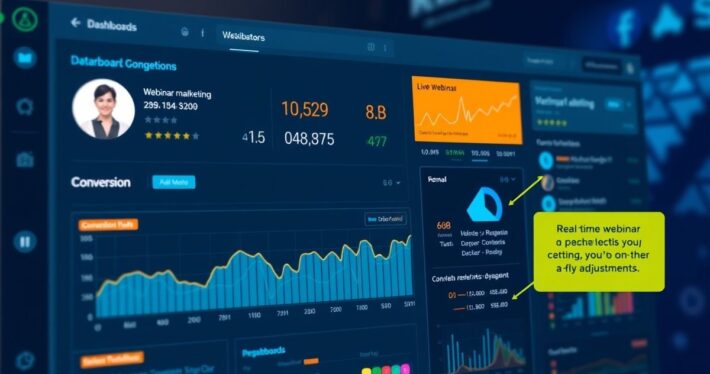
Webinars have become a cornerstone of modern digital marketing strategies, but how do you know if yours are actually working? Without the right metrics, you’re essentially flying blind. That’s where KPI dashboards come in. A well-designed KPI dashboard transforms raw data into actionable insights, helping you track performance, identify bottlenecks, and optimize your webinar strategy for maximum impact.
In this guide, we’ll walk you through everything you need to know about setting up KPI dashboards for your webinars—from choosing the right tools to tracking the most critical metrics. Whether you’re a seasoned webinar pro or just starting out, you’ll walk away with a clear roadmap to measure success and drive results.
Why Webinar KPIs Matter
Let’s start with the basics: What are KPIs, and why should you care about them? KPIs, or Key Performance Indicators, are measurable values that show how effectively you’re achieving your goals. For webinars, KPIs might include registration rates, attendance percentages, or conversion rates.
Think of KPIs as your webinar’s report card. They tell you what’s working, what’s not, and where you need to focus your efforts. Without them, you’re left guessing—and that’s a recipe for wasted time and resources.
Essential Metrics for Your Webinar KPI Dashboard
Not all metrics are created equal. To get the most out of your KPI dashboard, focus on the ones that directly tie to your goals. Here’s a breakdown of the most important webinar metrics:
- Registration Rate
- How many people signed up for your webinar?
- Formula: (Number of Registrations / Total Reach) x 100
- Attendance Rate
- What percentage of registrants actually showed up?
- Formula: (Number of Attendees / Number of Registrations) x 100
- Engagement Rate
- How active were your attendees during the webinar?
- Metrics to track: Poll responses, chat activity, Q&A participation
- Conversion Rate
- How many attendees took the desired action (e.g., purchased a product, booked a demo)?
- Formula: (Number of Conversions / Number of Attendees) x 100
- Drop-Off Rate
- At what point did attendees leave the webinar?
- This helps you identify potential issues with content or delivery.
- Cost Per Lead (CPL)
- How much does it cost to acquire a lead through your webinar?
- Formula: Total Webinar Cost / Number of Leads Generated
Tools for Building Your KPI Dashboard
Now that you know which metrics to track, let’s talk about the tools you’ll need to build your KPI dashboard. Here are some of the best options:
- Google Analytics
- Great for tracking traffic sources, conversions, and user behavior.
- Platform-Specific Analytics (e.g., Zoom, Webex)
- Most webinar platforms offer built-in analytics to track attendance, engagement, and more.
- BI Tools (e.g., Tableau, Power BI)
- Ideal for creating custom dashboards with advanced visualizations.
- Marketing Automation Platforms (e.g., HubSpot, Marketo)
- Useful for tracking lead generation and nurturing metrics.
Step-by-Step Guide to Setting Up Your Dashboard
Ready to create your KPI dashboard? Follow these steps:
- Define Your Goals
- What do you want to achieve with your webinar? (e.g., generate leads, sell a product, educate your audience)
- Choose the Right Metrics
- Select KPIs that align with your goals (refer to the list above).
- Set Up Data Integration
- Connect your webinar platform, email marketing tool, and CRM to ensure all data is centralized.
- Design Your Dashboard
- Use a tool like Google Data Studio or Tableau to create a visually appealing and easy-to-read dashboard.
- Automate Reporting
- Set up automated reports to save time and keep stakeholders informed.
- Analyze and Optimize
- Regularly review your dashboard to identify trends, spot issues, and make data-driven improvements.
Real-World Example: How One Company Increased Conversions by 30%
Let’s look at a real-world example. A SaaS company hosting a product demo webinar wanted to improve their conversion rate. They set up a KPI dashboard to track attendance, engagement, and conversions.
By analyzing the data, they discovered that attendees who participated in live polls were 50% more likely to convert. Armed with this insight, they added more interactive elements to their webinars, resulting in a 30% increase in conversions over three months.
Common Pitfalls to Avoid
Even with the best tools, setting up a KPI dashboard isn’t foolproof. Here are some common mistakes to watch out for:
-
Tracking Too Many Metrics
Focus on the KPIs that matter most to avoid information overload. -
Lack of Context
Don’t just look at numbers—understand what they mean for your strategy. -
Ignoring Qualitative Data
Metrics like attendee feedback and survey responses can offer valuable insights. -
Inconsistent Monitoring
Regularly review your dashboard to stay on top of performance.
Advanced Tips for Webinar Success
Looking to take your webinar game to the next level? Here are some pro tips:
-
Segment Your Audience
Use your KPI dashboard to analyze performance by audience segment (e.g., industry, job role). -
A/B Test Your Content
Experiment with different formats, topics, and CTAs to see what resonates best. -
Leverage AI Tools
AI-powered tools like Slide Outline Creators and Offer Builders can help you create more engaging and high-converting webinars. -
Monitor Trends Over Time
Look for patterns in your data to identify long-term opportunities for improvement.
Final Thoughts
Setting up a KPI dashboard for your webinar isn’t just a nice-to-have—it’s a must if you’re serious about driving results. By tracking the right metrics, using the right tools, and regularly analyzing your data, you’ll be able to optimize your webinars for maximum impact.
So, what are you waiting for? Start building your KPI dashboard today and take your webinar strategy to the next level. And remember, the right tools (like AI-powered webinar creators) can make the process even easier and more effective.


