Introduction to Webinar Analytics: Key Metrics to Track

Imagine hosting a webinar and having no idea how it performed. Did people stay engaged? Did your offer convert? Were your slides effective? Without webinar analytics, you’re essentially flying blind in a storm of uncertainty. Webinar analytics are the compass that guides your strategy, helping you understand what works, what doesn’t, and how to improve. In this guide, we’ll break down the key metrics you need to track to turn your webinars into high-converting machines.
Let’s be honest: hosting a webinar is only half the battle. The real magic happens when you analyze the data to refine your approach. Whether you’re a seasoned pro or a webinar newbie, understanding these metrics will empower you to make smarter decisions and achieve better results.
Why Webinar Analytics Matter (And Why Most People Get Them Wrong)
Webinar analytics aren’t just about numbers—they’re about storytelling. Every metric tells a story about your audience’s behavior, preferences, and pain points. But here’s the catch: many people get overwhelmed by the sheer volume of data or focus on the wrong metrics altogether.
For example, tracking how many people registered for your webinar is important, but it’s only the starting point. What matters more is how many of them actually showed up and stayed engaged throughout the session. That’s where webinar analytics truly shine—they help you dig deeper into the “why” behind the numbers.
Now, here’s where it gets interesting: the right metrics can help you identify opportunities to optimize your webinar content, improve engagement, and ultimately drive more conversions. Let’s dive into the essential metrics you should be tracking.
Key Metrics to Track for Webinar Success
1. Registration Metrics
Think of registration metrics as your first impression. They tell you how well your promotional efforts resonated with your target audience. Key numbers to track include:
- Total registrations
- Registration conversion rate (how many people signed up vs. how many saw your offer)
- Sources of registrations (email, social media, paid ads, etc.)
Pro Tip: If your registration numbers are low, it’s time to revisit your landing page copy, offer, or promotional channels.
2. Attendance Metrics
Here’s the harsh truth: not everyone who registers will show up. Attendance metrics give you insights into how many people actually attended your webinar and how engaged they were. Focus on:
- Attendance rate (total attendees divided by total registrations)
- Average viewing time
- Drop-off points (when people left the webinar)
Let’s put this into perspective: If 100 people registered but only 30 showed up, your attendance rate is 30%. Not great, right? This could indicate issues with your email reminders, timing, or even the perceived value of your webinar.
3. Engagement Metrics
Engagement is the heart of any successful webinar. After all, an engaged audience is more likely to convert. Key engagement metrics include:
- Poll and survey responses
- Q&A participation
- Chat activity
- Click-through rates on links or offers
For example, if you notice a surge in chat activity during a specific segment of your webinar, that’s a clear sign your audience found that topic compelling. Use this data to double down on what resonates.
4. Conversion Metrics
At the end of the day, conversions are what matter most. Whether your goal is to generate leads, sell a product, or build your email list, these metrics are non-negotiable:
- Conversion rate (percentage of attendees who took the desired action)
- Revenue generated (for paid webinars or product offers)
- Follow-up engagement (opens, clicks, and replies from post-webinar emails)
5. Performance Metrics
Performance metrics give you a bird’s-eye view of your webinar’s overall effectiveness. These include:
- Attendee satisfaction score (via post-webinar surveys)
- Replay views and engagement
- ROI (revenue generated vs. costs incurred)
Real-World Example: How Webinar Analytics Transformed a Campaign
Let’s look at a quick case study. One of my clients hosted a webinar to promote a new course. Initially, they focused solely on registration numbers, which were impressive (500+ sign-ups). But when they dug into the analytics, they discovered only 40% of registrants attended, and the average viewing time was just 25 minutes.
By analyzing the drop-off points, they realized the introduction was too long and technical. They revamped the opening to make it more engaging and added an interactive poll early on. The result? Attendance increased to 65%, and the average viewing time jumped to 45 minutes. Better yet, their conversion rate doubled.
Tools to Simplify Webinar Analytics
Now, you might be thinking, “This sounds great, but how do I actually track all this?” Here’s the good news: most webinar platforms (like Zoom, Webex, or Demio) come with built-in analytics. For deeper insights, consider integrating tools like Google Analytics, HubSpot, or even AI-powered webinar platforms that provide advanced tracking and reporting.
Common Pitfalls to Avoid
- Focusing on vanity metrics: Don’t get distracted by big numbers that don’t actually impact your goals.
- Ignoring qualitative data: Metrics like attendee feedback and chat transcripts can provide valuable context.
- Not acting on insights: Data is useless if you don’t use it to improve your next webinar.
Final Thoughts: Turning Data Into Action
Webinar analytics are your secret weapon for creating high-converting, audience-focused webinars. By tracking the right metrics, you’ll gain a deeper understanding of your audience, optimize your content, and ultimately achieve better results.
So, the next time you host a webinar, don’t just celebrate the registration numbers. Dive into the analytics, uncover the stories behind the data, and use those insights to refine your strategy. After all, knowledge is power—and in the world of webinars, analytics are the ultimate source of knowledge.
Feature-image-description:
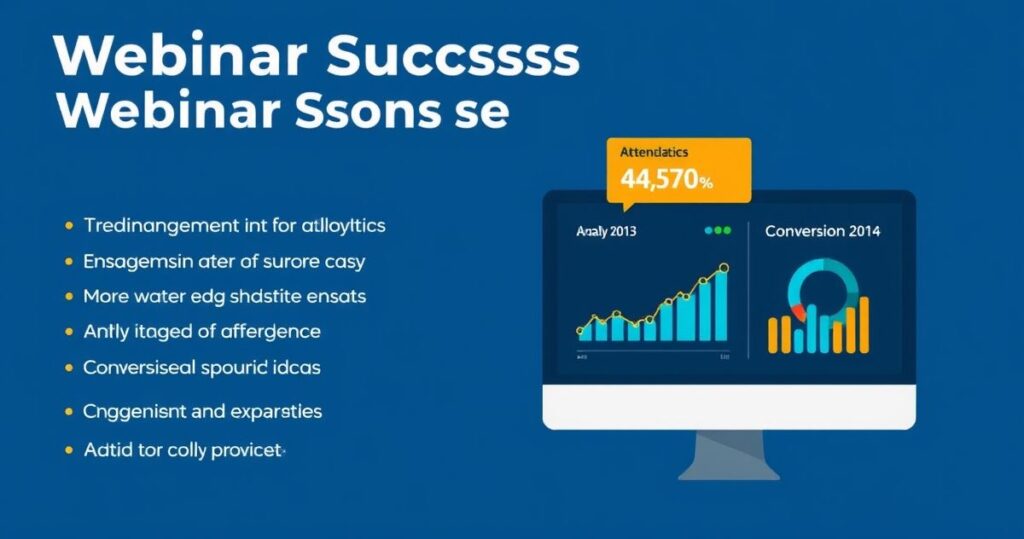
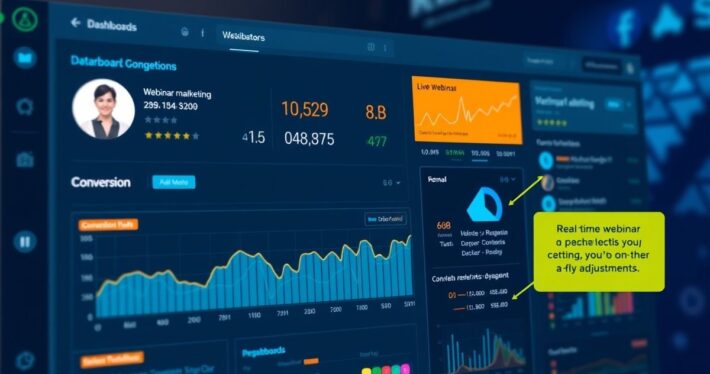
A clean, modern graphic showing a webinar dashboard with key analytics metrics like attendance rate, engagement, and conversion rate displayed on a digital screen. The image emphasizes the importance of data-driven decision-making in webinar success, with a focus on actionable insights and optimization.


