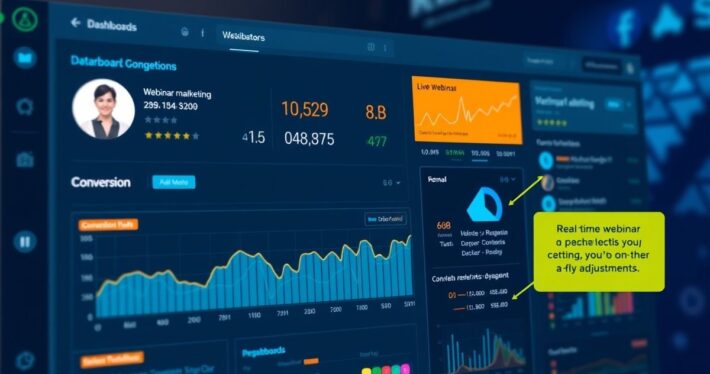
Using Google Analytics for Webinar Performance Tracking
Using Google Analytics for Webinar Performance Tracking: A Comprehensive Guide
In today’s digital landscape, webinars have become a cornerstone of effective marketing strategies. But how do you know if your webinar is truly performing well? Enter Google Analytics—your go-to tool for tracking webinar performance, understanding attendee behavior, and optimizing your conversions. Whether you’re a seasoned marketer or just starting out, this guide will walk you through the ins and outs of using Google Analytics to measure your webinar’s success.
Why Google Analytics is Essential for Webinar Performance Tracking
Let’s be honest—running a webinar without tracking its performance is like driving blindfolded. You might reach your destination, but chances are you’ll miss a few turns along the way. Google Analytics provides the data-driven insights you need to make informed decisions, optimize your strategy, and ultimately, achieve your goals.
From tracking attendee engagement to measuring conversion rates, Google Analytics offers a wealth of information that can help you fine-tune your webinar efforts. But how do you get started? Let’s dive in.
Setting Up Google Analytics for Your Webinar
Before you can start tracking, you’ll need to set up Google Analytics properly. Here’s a step-by-step guide:
-
Create a Google Analytics Account: If you don’t already have one, sign up for Google Analytics. It’s free and easy to set up.
-
Set Up a New Property: Create a new property specifically for your webinar. This will help you isolate data and analyze it more effectively.
-
Install the Tracking Code: Once your property is set up, Google will provide you with a tracking code. Add this code to the landing page where you promote your webinar. If you’re using a webinar platform like Zoom or WebinarJam, check their documentation to see if they support Google Analytics integration.
-
Set Up Goals: Goals are crucial for tracking conversions. Whether it’s registrations, sign-ups, or purchases, setting up goals will help you measure the success of your webinar. Go to Admin > Goals > New Goal, and follow the prompts to create a goal that aligns with your webinar objectives.
Key Metrics to Track in Google Analytics
Now that your setup is complete, it’s time to track the metrics that matter. Here are the key performance indicators (KPIs) you should focus on:
-
Traffic Sources: Where are your attendees coming from? Are they finding you through organic search, social media, or paid ads? Understanding your traffic sources will help you allocate your marketing budget more effectively.
-
Bounce Rate: A high bounce rate on your landing page could indicate that your messaging isn’t resonating with your audience. Use this data to tweak your copy, design, or offer.
-
Conversion Rate: This is the ultimate metric to track. How many of your visitors are converting into webinar attendees? If your conversion rate is low, consider optimizing your landing page or offer.
-
Engagement Metrics: Once the webinar is live, track metrics like average session duration, pages per session, and event completions to gauge attendee engagement.
-
Post-Webinar Behavior: What happens after the webinar? Are attendees visiting your sales page, signing up for a free trial, or making a purchase? Tracking post-webinar behavior will help you measure the long-term impact of your webinar.
Real-World Example: How Company X Boosted Webinar ROI with Google Analytics
Let’s look at a real-world example. Company X, a B2B SaaS company, was struggling to convert webinar attendees into paying customers. By using Google Analytics, they discovered that most attendees were dropping off during the Q&A session. Armed with this insight, they revamped their Q&A format, making it more interactive and engaging. The result? A 30% increase in post-webinar conversions.
Advanced Tips for Webinar Performance Tracking
Ready to take your webinar tracking to the next level? Here are some advanced tips:
-
UTM Parameters: Use UTM parameters to track the performance of individual marketing campaigns. This will give you a granular view of which campaigns are driving the most registrations.
-
Event Tracking: Set up event tracking to measure specific actions during your webinar, like button clicks, video plays, or poll responses.
-
Segmentation: Use segmentation to analyze different groups of attendees. For example, you could create a segment for attendees who stayed for the entire webinar versus those who dropped off early.
-
A/B Testing: Experiment with different webinar formats, landing pages, and offers. Use Google Analytics to track the results and identify what works best.
Common Challenges and How to Overcome Them
Tracking webinar performance isn’t without its challenges. Here are some common pitfalls and how to avoid them:
-
Incomplete Data: Missing tracking codes or improperly set goals can lead to incomplete data. Double-check your setup to ensure everything is working correctly.
-
Data Overload: With so much data available, it’s easy to get overwhelmed. Focus on the metrics that align with your objectives and ignore the rest.
-
Attribution Issues: Determining which marketing efforts led to a conversion can be tricky. Use UTM parameters and multi-channel funnels to get a clearer picture.
Conclusion: Unlock the Full Potential of Your Webinars with Google Analytics
Google Analytics is a powerful tool that can transform the way you track and optimize your webinars. By setting up proper tracking, focusing on key metrics, and leveraging advanced features, you can gain actionable insights that drive real results. So, what are you waiting for? Start using Google Analytics today and unlock the full potential of your webinars.


