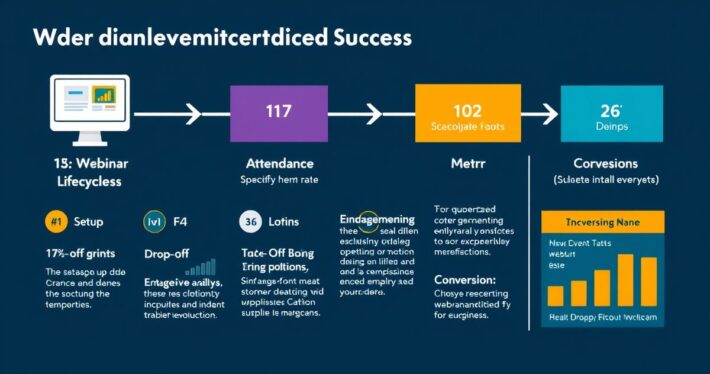
Webinar performance tracking: The metrics that matter most.
Webinar performance tracking isn’t just about checking boxes—it’s about understanding what works, what doesn’t, and how to optimize for better results. Whether you’re hosting a webinar to generate leads, sell a product, or educate your audience, the metrics you track can make or break your success. Let’s dive into the most important metrics that matter and how to use them to refine your webinar strategy.
Why Webinar Metrics Matter
Webinars are a powerful tool for engagement and conversion, but without tracking the right metrics, you’re flying blind. Think of it like driving a car without a dashboard—you might reach your destination, but you’ll have no idea how efficiently you got there. Metrics provide the insights you need to improve attendance, engagement, and conversions, and they help you justify the ROI of your efforts.
Now, here’s where it gets interesting: not all metrics are created equal. Some are vanity metrics that look good on paper but don’t drive real results. Others are actionable insights that can transform your webinar strategy. So, which ones should you focus on? Let’s break it down.
The Most Important Webinar Metrics to Track
1. Registration Rate
Your registration rate is the first indicator of your webinar’s potential success. It tells you how well your marketing efforts are resonating with your target audience. To calculate it, divide the number of registrations by the number of people who were exposed to your webinar promotion.
Pro Tip: A low registration rate could mean your messaging isn’t compelling enough or your target audience isn’t well-defined. Experiment with different headlines, offers, or targeting strategies to improve performance.
2. Attendance Rate
Here’s a hard truth: not everyone who registers will show up. Attendance rate measures how many registrants actually attend your webinar live. A good attendance rate typically falls between 40-60%, depending on your industry and audience.
Why this matters: Low attendance could indicate poor timing, lack of interest, or ineffective reminders. Send timely reminders, create urgency with exclusive content, or offer bonuses for live attendees to boost this number.
3. Engagement Rate
Engagement is where the magic happens. This metric includes everything from chat activity, poll responses, and Q&A participation to slide interactions. High engagement means your audience is invested in your content, which often leads to higher conversions.
Real-world example: A SaaS company hosting a product demo webinar noticed a 20% increase in engagement when they introduced live polls and Q&A sessions. This directly correlated with a 15% boost in post-webinar conversions.
4. Drop-Off Rate
The drop-off rate shows how many attendees leave your webinar before it ends. A high drop-off rate is a red flag—it means your content isn’t holding attention or your webinar is running too long.
How to fix it: Keep your webinars concise (60 minutes max), use storytelling to maintain interest, and include interactive elements to keep attendees engaged.
5. Conversion Rate
This is the ultimate metric for most webinar hosts. Conversion rate measures how many attendees took the desired action, whether it’s signing up for a free trial, purchasing a product, or booking a consultation.
Key insight: A well-structured webinar with a clear call-to-action (CTA) can achieve conversion rates of 20-30% or higher. To optimize, ensure your offer is irresistible, your CTA is clear, and your post-webinar follow-up is timely.
6. ROI (Return on Investment)
Let’s be honest about this: if your webinar isn’t generating ROI, it’s not worth the effort. To calculate ROI, compare the revenue generated from your webinar to the costs of hosting it (e.g., platform fees, marketing spend, speaker fees).
Example: A $2,000 webinar that generates $10,000 in sales has a 400% ROI. If your ROI is low, revisit your targeting, offer, or follow-up strategy.


